Dashboard
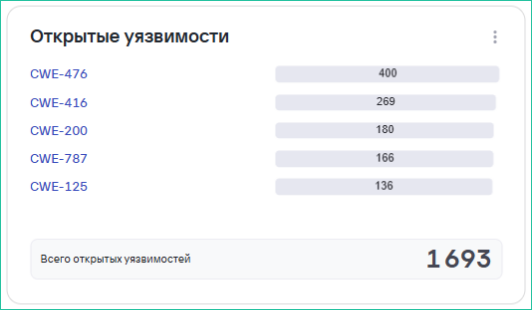
Dashboard Overview
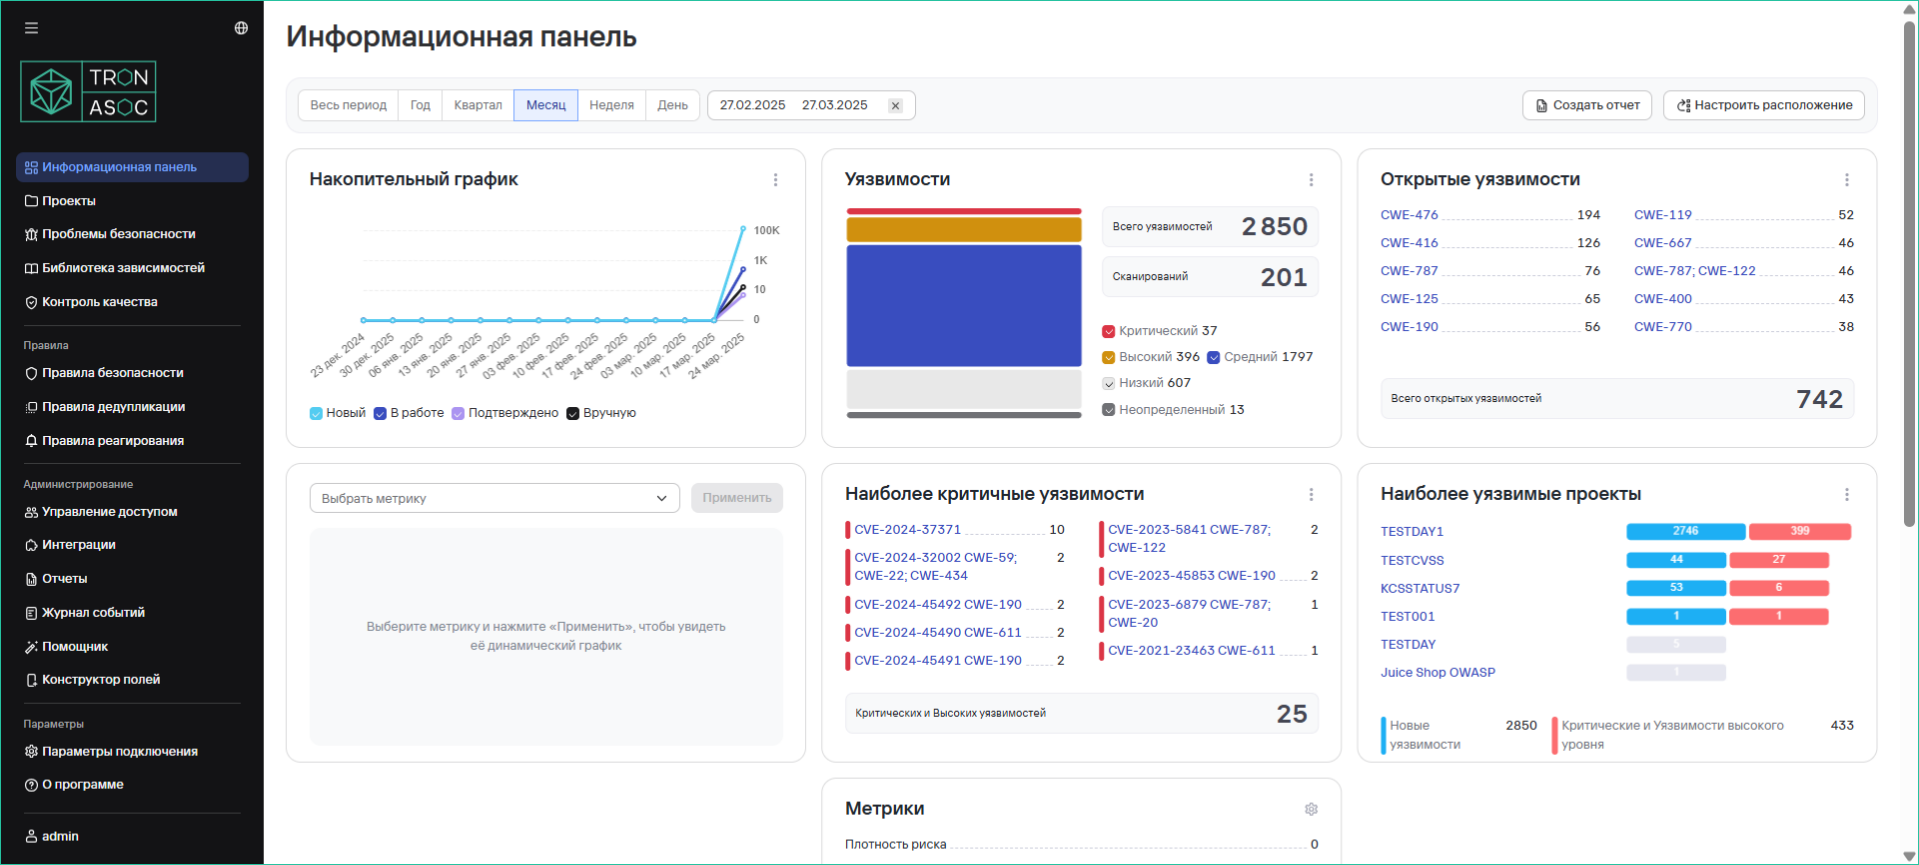
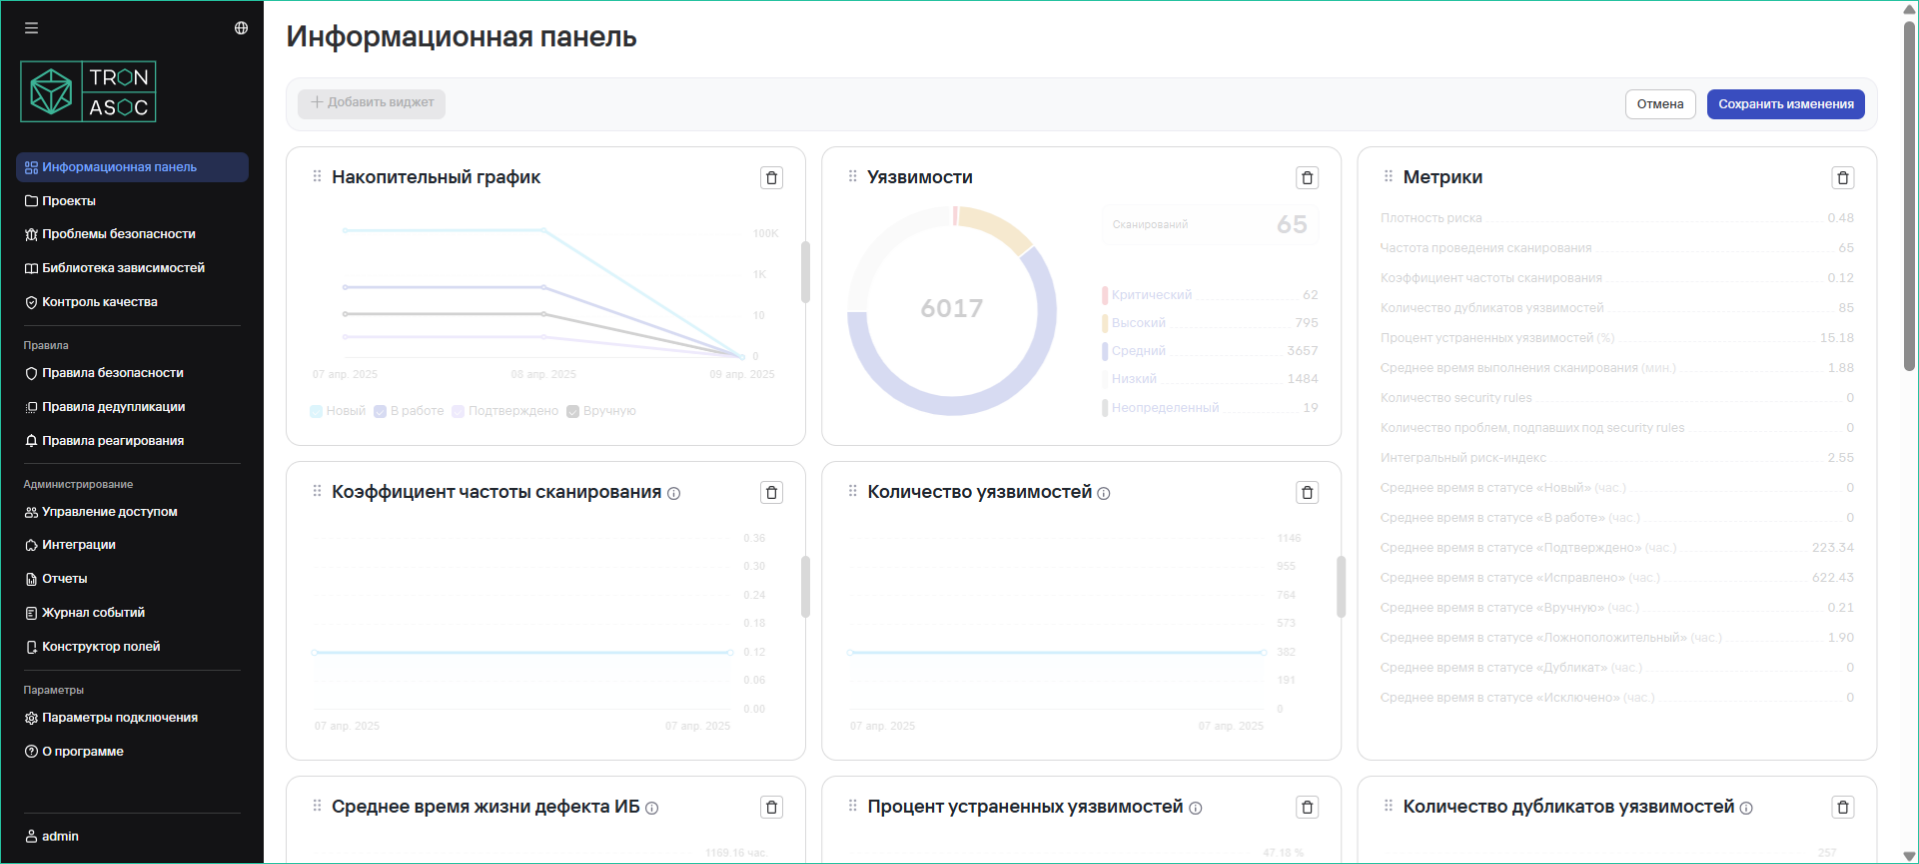
The dashboard displays summary charts (widgets) for vulnerabilities over a selected period. Data is updated once every 24 hours.
Available Widgets
Widget visibility depends on the user's access rights.
-
Cumulative chart of detected vulnerabilities
-
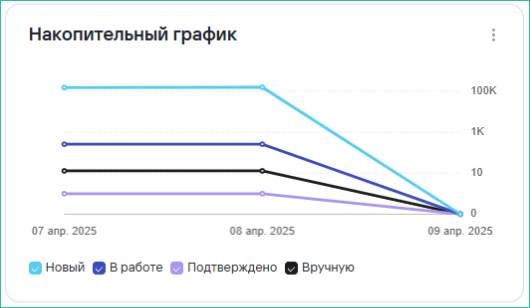
Total number of vulnerabilities
-
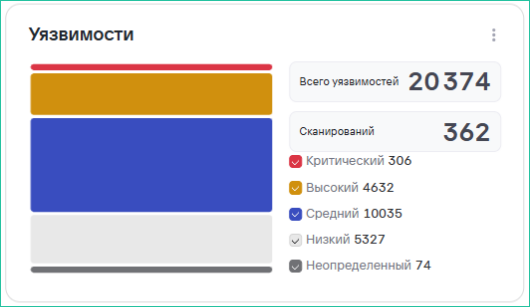
Open vulnerabilities
-
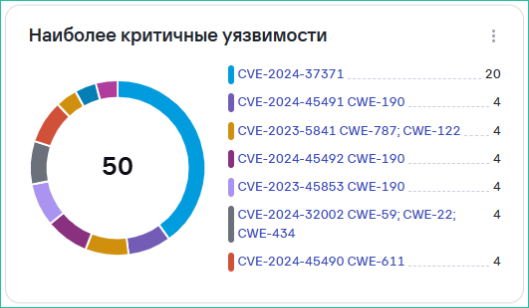
Most critical vulnerabilities
-
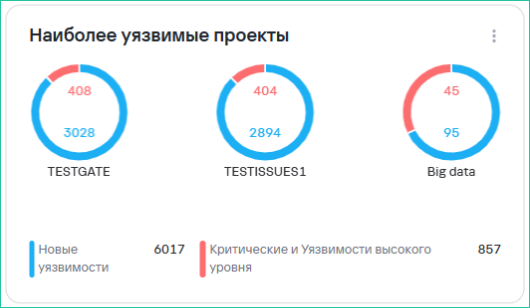
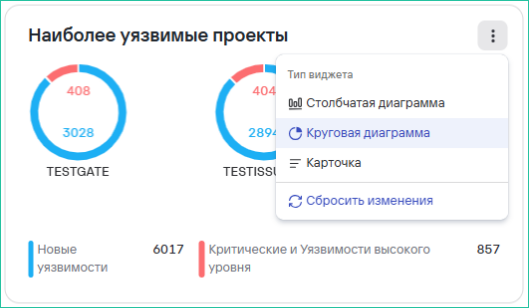
Most vulnerable projects
-
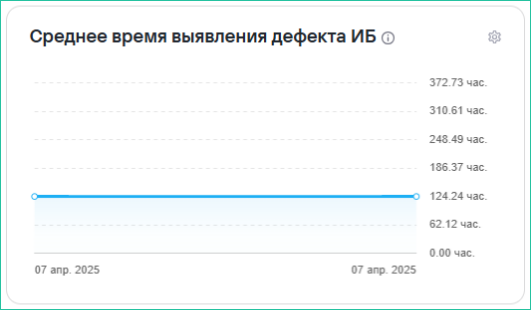
Average time to detect security defects
-
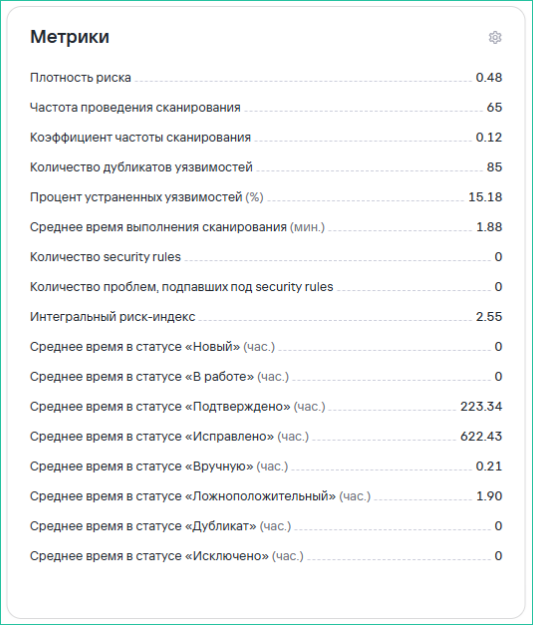
Security metrics:
- Scan frequency rate
- Number of vulnerabilities
- Average lifespan of a security defect
- Percentage of remediated vulnerabilities
- Number of duplicate vulnerabilities
- Average time to fix a security defect
- Risk density
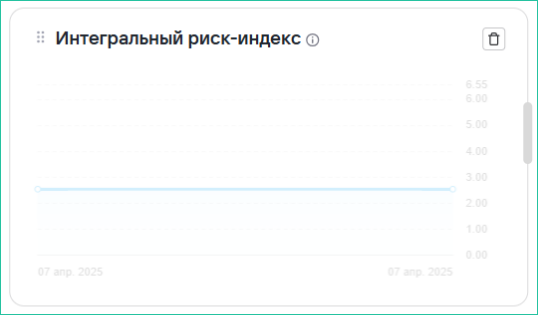
- Composite risk index
Calculation Formulas
Key Metrics
-
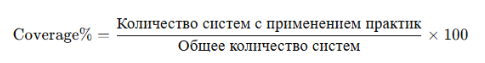
Coverage by secure development practices:
-
Average Defect Lifespan (Lead Time) is calculated as the median time a defect exists, i.e., from the New status to any closed status (Suppress, Fixed, etc.).
-
Mean Time To Detect (MTTD) is calculated as the median time to detect defects in a project/projects. Defect detection implies a status change from New to any subsequent status.
-
Mean Time To Remediate (MTTR) is calculated as the median time from an open status, other than New, to a closed status.
-
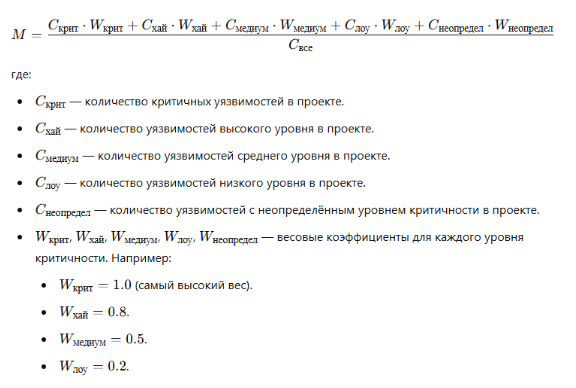
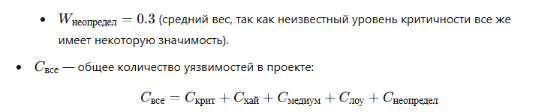
Risk Density (M):
-
Average Scan Time calculates the average scanning duration.
-
Percentage of Remediated Vulnerabilities is calculated as the ratio of closed vulnerabilities to the total number of vulnerabilities in a project.
-
Average Time in a Specific Status is calculated as the median time spent in each status, expressed in whole hours.
-
Composite Risk Index:

where:
- H - Risk Density
- V - Scan Frequency Rate coefficient
- L - Remediation Time coefficient
-
Coefficient V (Scan Frequency Rate coefficient) is calculated using the following formula: V = (Maximum Scan Frequency − Minimum Scan Frequency) / (Project Scan Frequency − Minimum Scan Frequency) This formula normalizes the project's scan frequency relative to the minimum and maximum scan frequencies across all projects. This ensures the V coefficient ranges from 0 to 1 and is positive.
-
Defect Remediation and Detection Time Coefficient L assesses the speed of vulnerability remediation relative to the median value, calculated using the following formula:
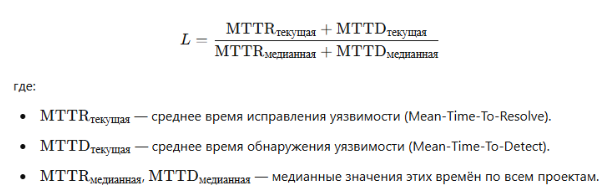
L reflects the deviation of defect processing times from median values. The faster a project remediates and detects defects, the lower the L value. Other used metrics are calculated based on the metrics listed above, counting values based on given parameters, and use simple arithmetic operations.
Widget Settings
Edit Mode
-
Click Configure Layout
-
Available actions:
- Add a widget
- Move widgets (via drag and drop)
- Remove a widget
- Resize
- Save changes using the Save button
Configuring Display Type
Some widgets support different view options:
-
Bar chart
-
Pie chart
-
Card
- All charts support drill-down on click
- Data can be exported to CSV/PDF
- Predefined time periods are available