Информационная панель
Обзор панели
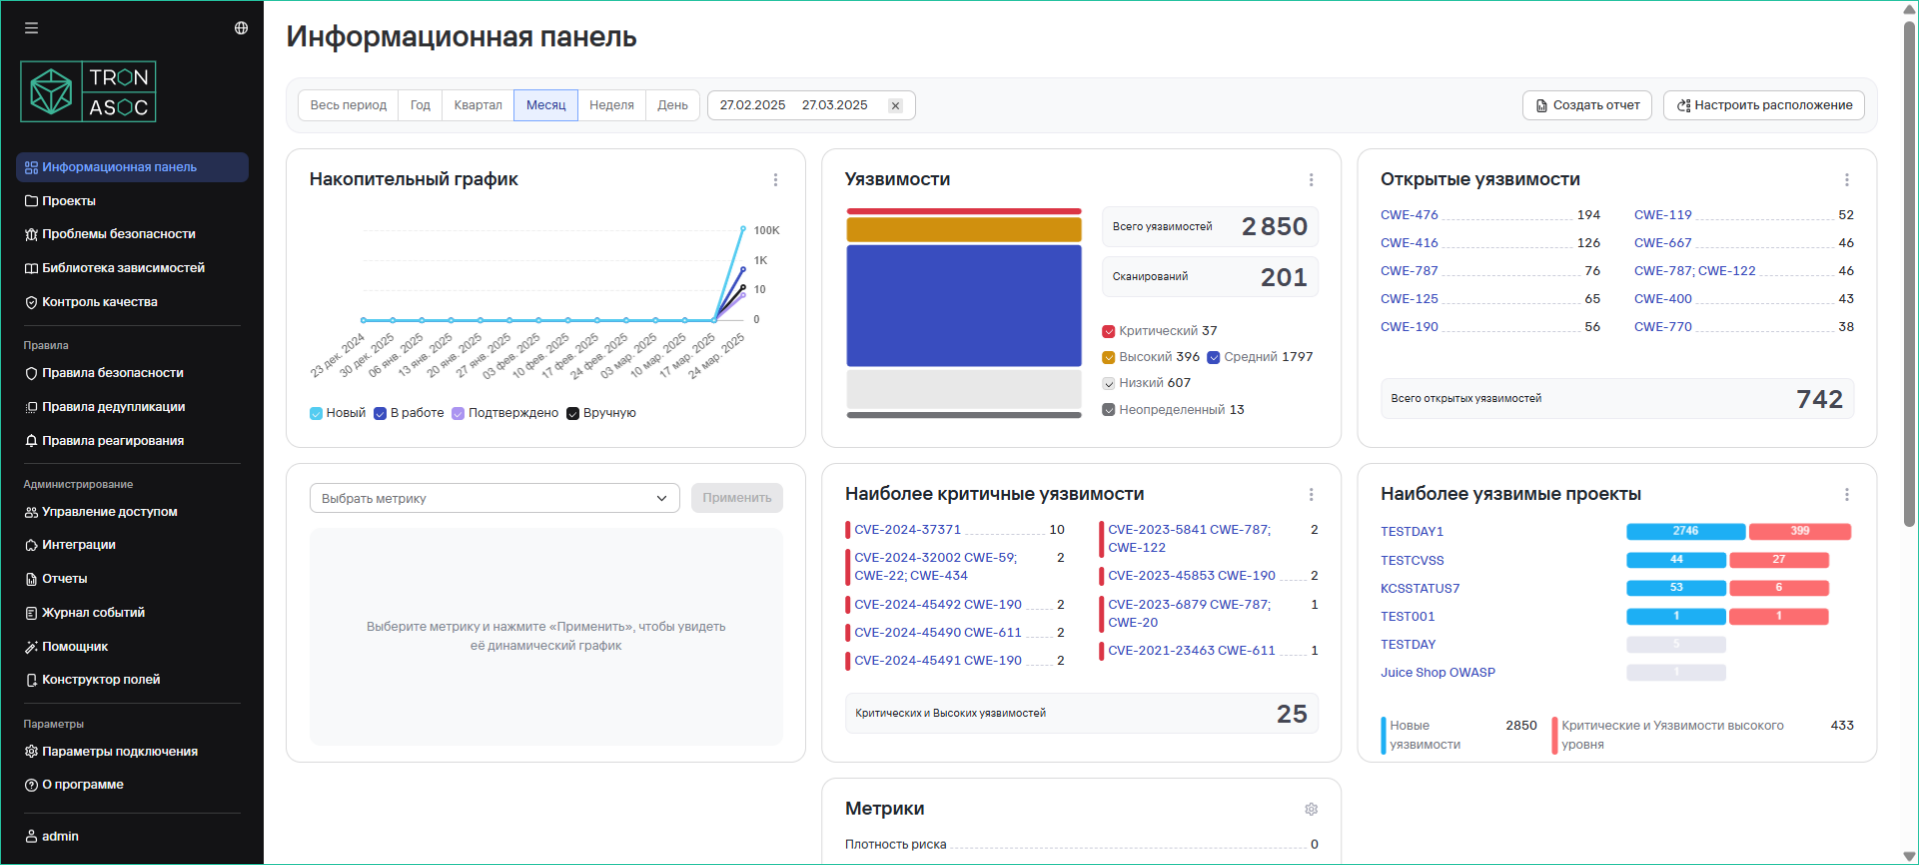
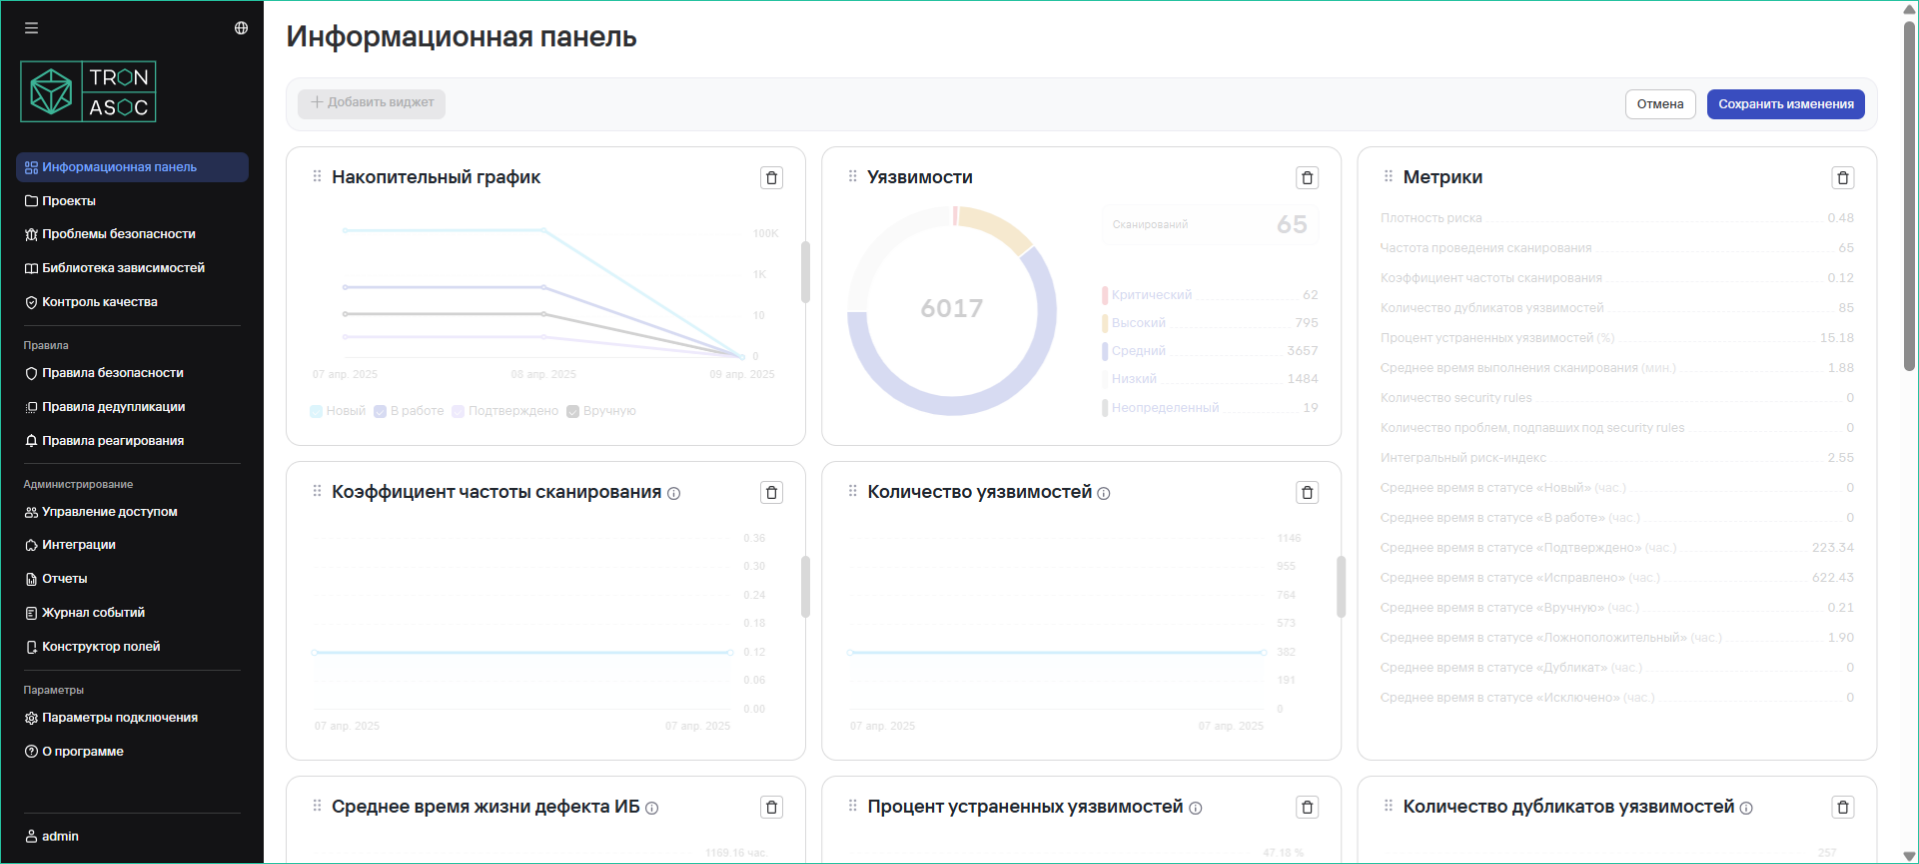
Информационная панель отображает сводные графики (виджеты) по уязвимостям за выбранный период. Данные обновляются раз в сутки.
Доступные виджеты
Отображение виджетов зависит от прав доступа пользователя/
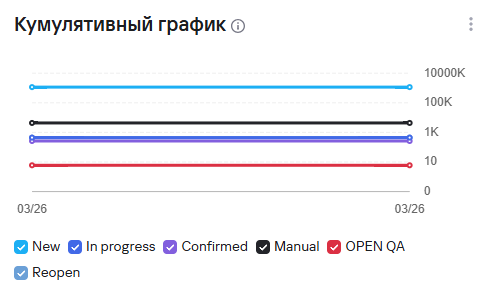
- Кумулятивный график выявленных уязвимостей (обновляется ежедневно в 00:00 по времени, указанному в конфигурационном файле)
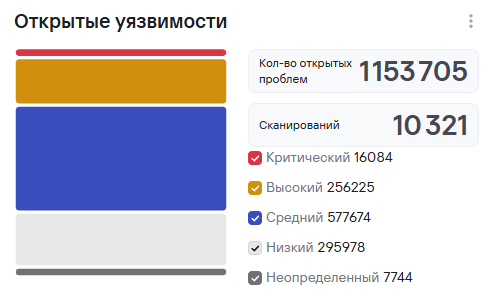
- Общее количество открытых уязвимостей
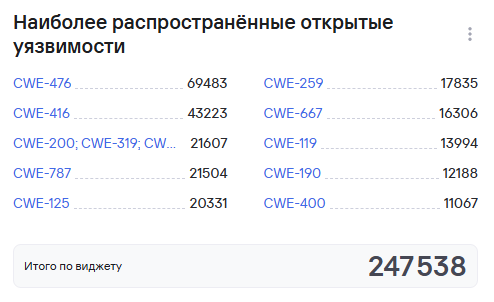
- Наиболее распространенные открытые уязвимости
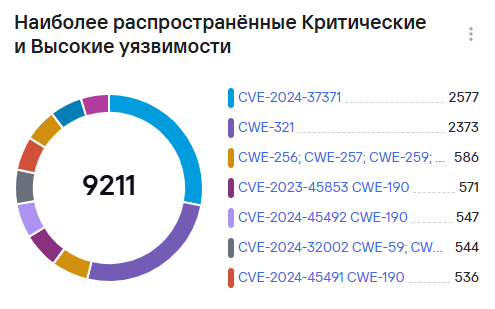
- Наиболее распространенные критические и высокие уязвимости
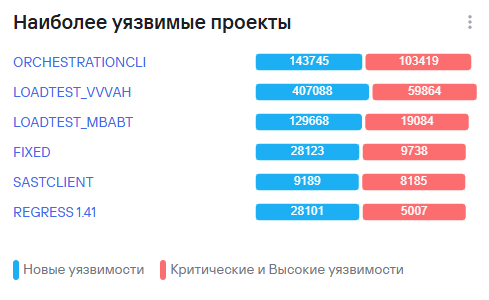
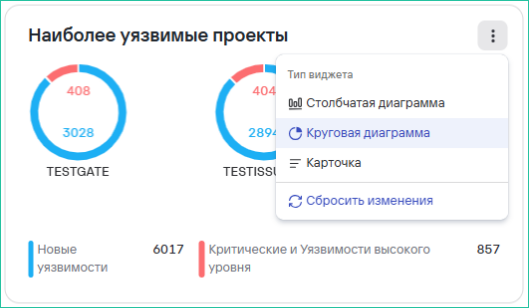
- Самые уязвимые проекты
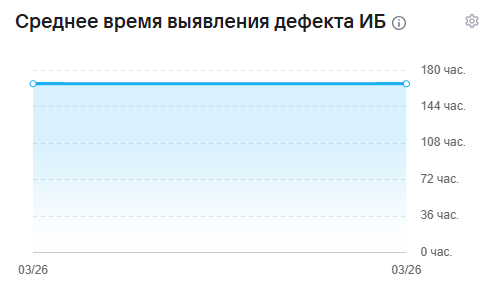
- Среднее время выявления дефекта ИБ (обновляется ежедневно в 00:00 по времени, указанному в конфигурационном файле)
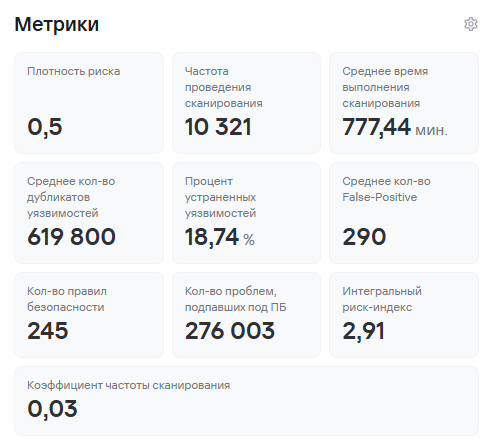
- Метрики безопасности
По метрикам предусмотрены отдельные виджеты для большей наглядности (в линейном виде, обновляется ежедневно в 00:00 по времени, указанному в конфигурационном файле):
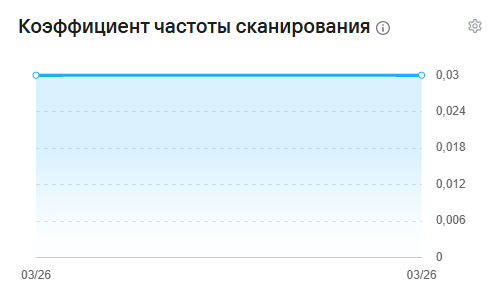
- Коэффициент частоты сканирования
- Количество уязвимостей

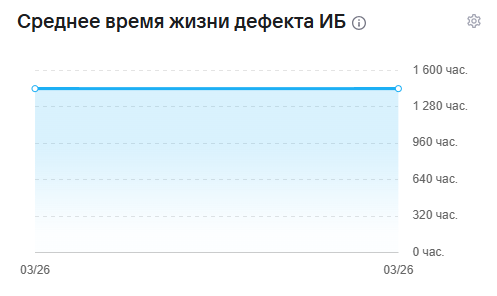
- Среднее время жизни дефекта ИБ
- Процент устраненных уязвимостей

- Количество дубликатов уязвимостей

- Количество False-positive

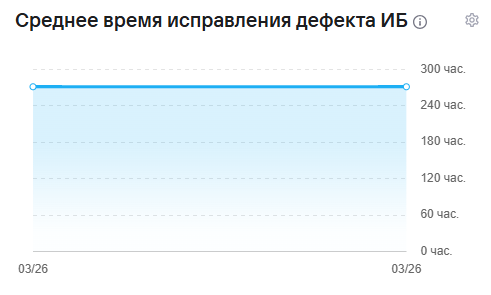
- Среднее время исправления дефекта ИБ
- Плотность риска

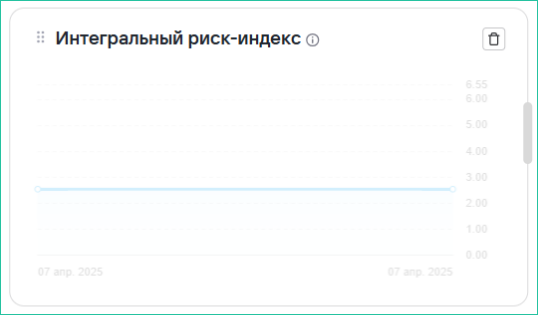
- Интегральный риск-индекс

Формулы расчетов показателей
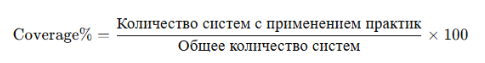
- Покрытие практиками безопасной разработки:
- Среднее время жизни дефекта (Lead Time) рассчитывается, как медианное время жизни дефекта, т.е. от статуса Новый (New) до любого закрытого статуса (Suppress, Fixed и т.д.).
- Среднее время идентификации (MTTD) рассчитывается, как медианное время идентификации дефектов в проекте/проектах. Под идентификацией дефекта подразумевается изменение статуса от Новый (New) до любого другого следующего статуса.
- Среднее время исправления (MTTR) рассчитывается, как медианное время от открытого статуса, отличного от Новый (New) до закрытого статуса.
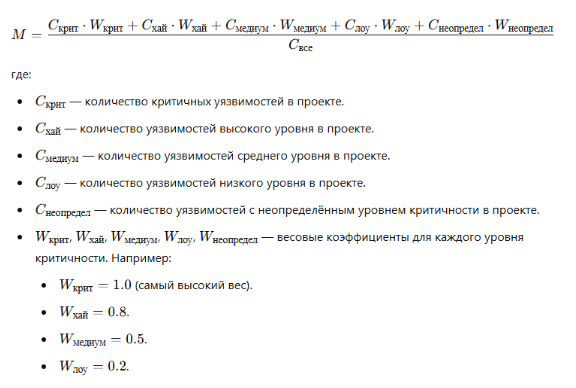
- Плотность риска (M):
- Среднее время сканирования рассчитывает среднее время сканирования.
- Процент устраненных уязвимостей рассчитывается, как отношение количества закрытых уязвимостей к общему числу уязвимостей в проекте.
- Среднее время нахождения в определенном статусе рассчитывается, как медианное время нахождения в каждом статусе в целочисленном формате часов.
- Интегральный риск-индекс:
![]()
где:
- H - плотность риска
- V - коэффициент частоты сканирования
- L - коэффициент времени исправления
-
Коэффициент V (коэффициент частоты сканирования) рассчитывается по следующей формуле: V = (Максимальная частота сканирования − Минимальная частота сканирования) / (Частота сканирования в проекте−Минимальная частота сканирования) Данная формула нормирует частоту сканирования в проекте относительно минимальной и максимальной частоты сканирования по всем проектам. Это гарантирует, что Коэффициент V будет находиться в диапазоне от 0 до 1 и будет положительным.
-
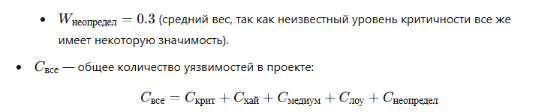
Коэффициент времени исправления и идентификации дефектов L оценивает скорость устранения уязвимостей относительно медианного значения, рассчитывается по следующей формуле:
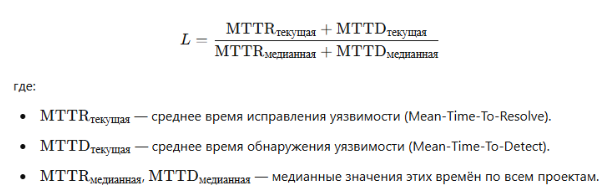
L отражает отклонение времени обработки дефектов от медианных значений. Чем быстрее проект исправляет дефекты и идентифицирует их, тем меньше значение L. Остальные используемые метрики рассчитываются на основе перечисленных выше метрик, подсчета количества значений по заданным параметрам, и используют простейшие операции вычисления.
Настройки виджетов
Режим редактирования
-
Нажмите Настроить расположение
-
Доступные действия:
- Добавить виджет
- Перемещать виджеты (перетаскиванием)
- Удалить виджет
- Изменить размер
- Сохраните изменения кнопкой Сохранить
Настройка типа отображения
Для некоторых виджетов доступны варианты:
-
Столбчатая диаграмма
-
Круговая диаграмма
-
Карточка
- Все графики поддерживают детализацию при клике
- Данные можно экспортировать в CSV/PDF
- Доступны предустановленные временные периоды
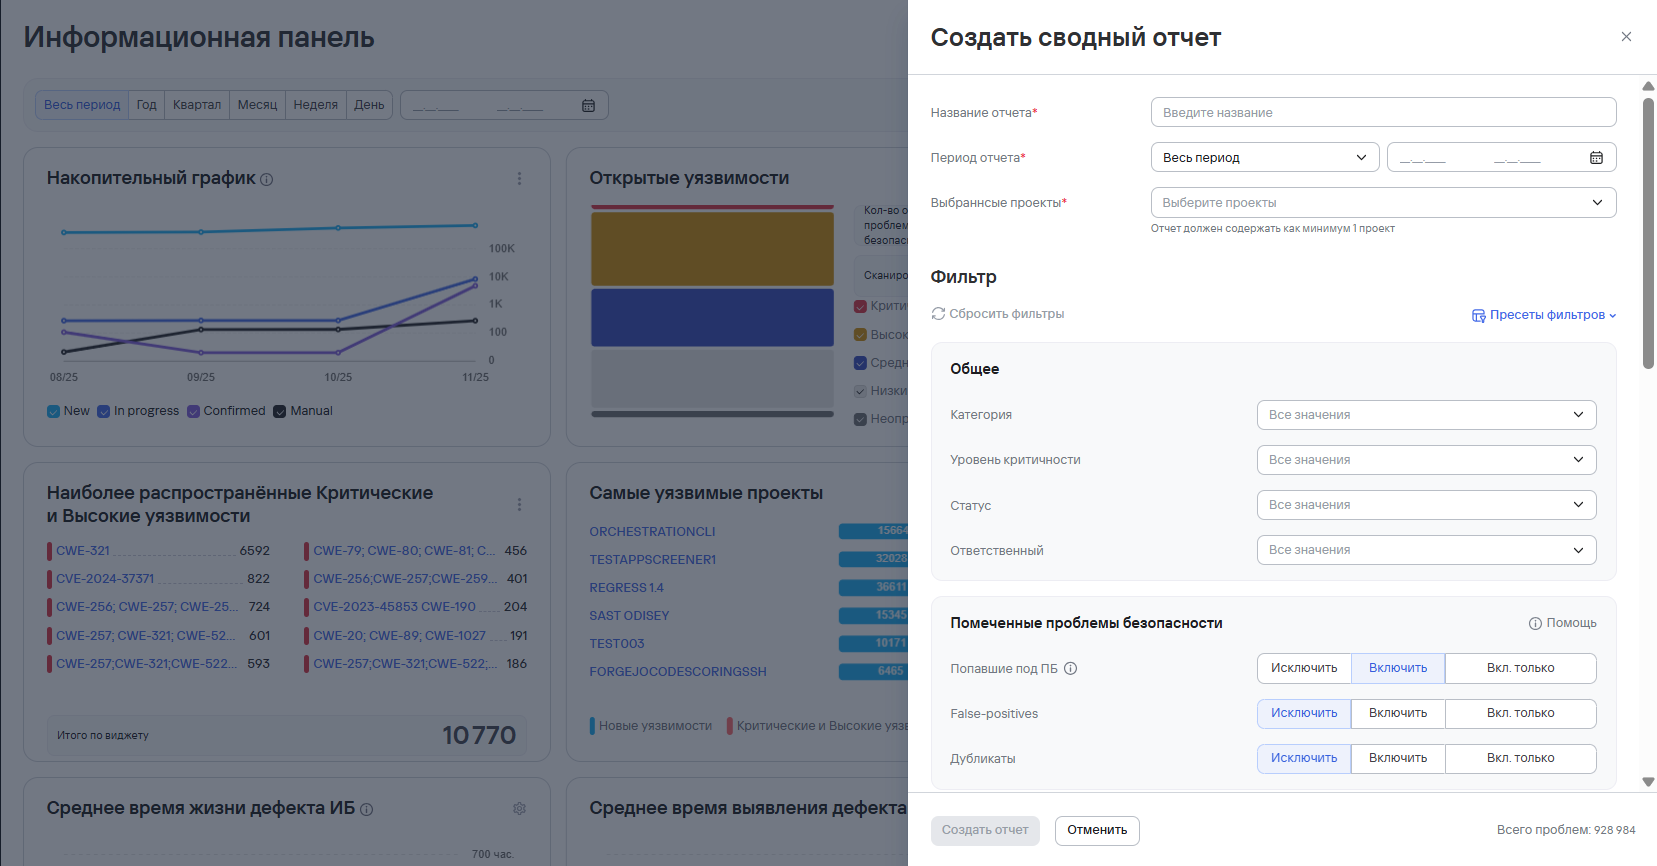
Сводные отчеты (по всем проектам)
Для формирования отчетов по всем проектам необходимо выполнить следующие шаги:
- На странице Информационная панель нажать на кнопку Создать отчет.
- Далее заполнить параметры отчета и необходимую фильтрацию.
По всем проектам доступен только Сводный отчет. Графики в Сводных отчетах формируются ТОЛЬКО по тем проектам, в которых были найдены проблемы безопасности. А также при настроенных фильтрах, в случае выбора нескольких проектов, некоторые фильтры могут не применяться к метрикам по причине настроек внутренней логики. Подробнее, о метриках и фильтрах см. Swagger (раздел Stats).
- Нажать на кнопку Создать отчет. Сформированный отчет будет находится в разделе Отчеты. Подробнее см. Отчеты.